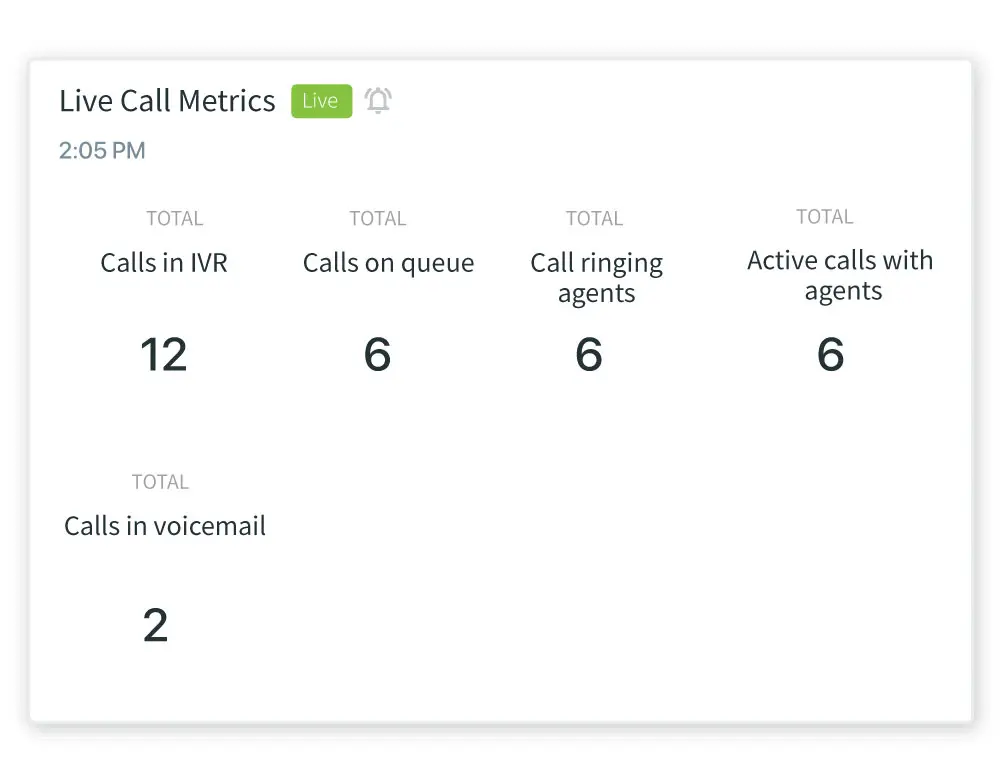
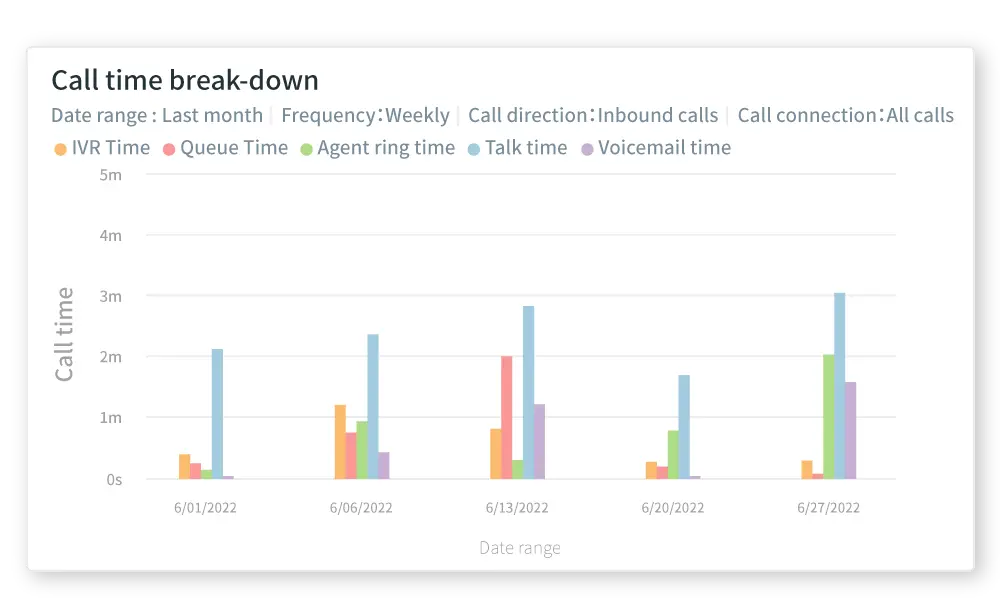
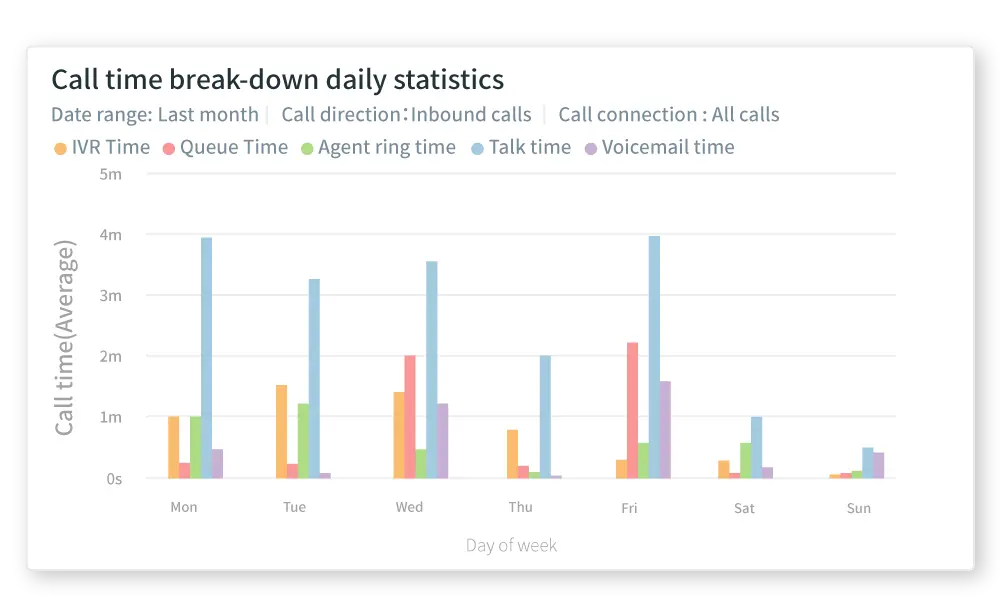
View the time that customers stay in each call stage including IVR time, queue time, agent ring time, call time and other information. For example, an agent whose ring time has suddenly increased may need assistance or further coaching.
Overview
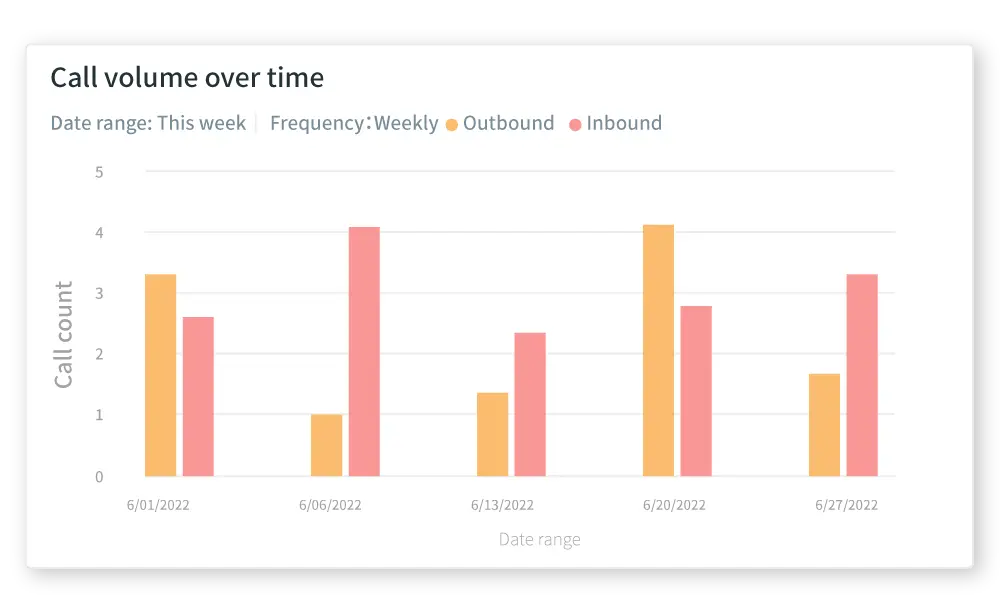
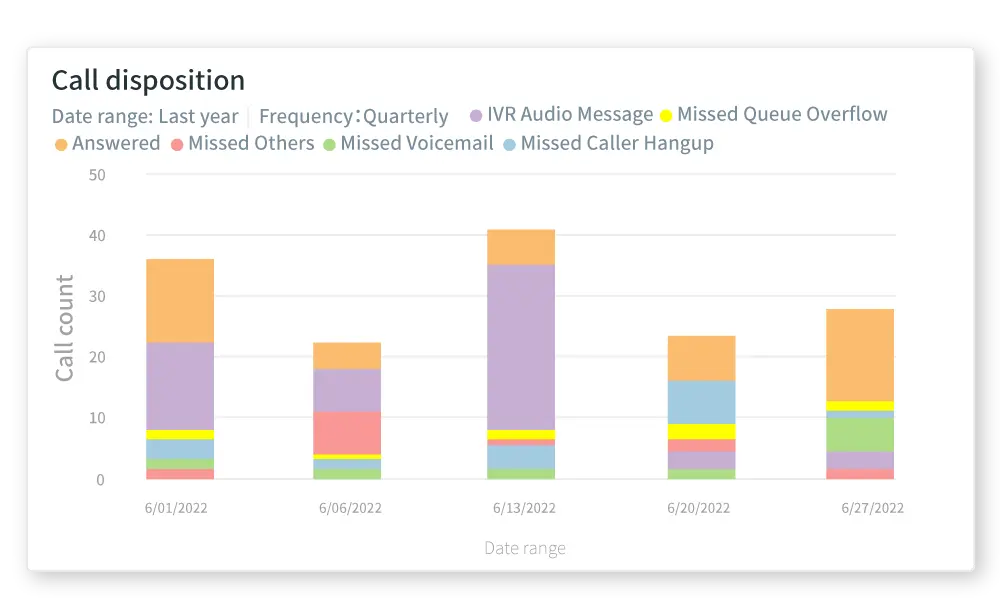
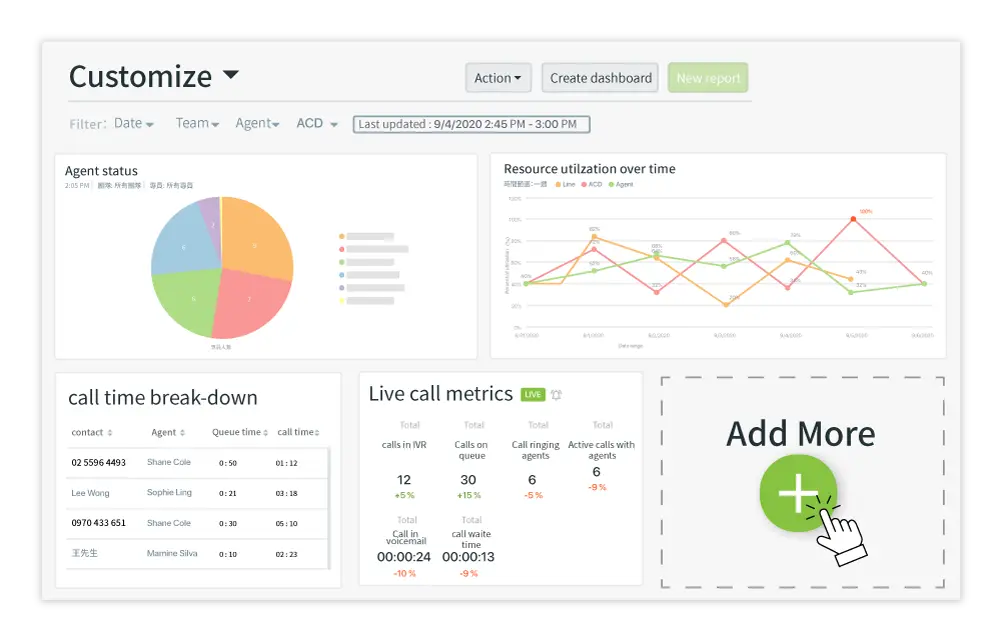
View call volume data within a specified time interval with weekly or daily statistics.
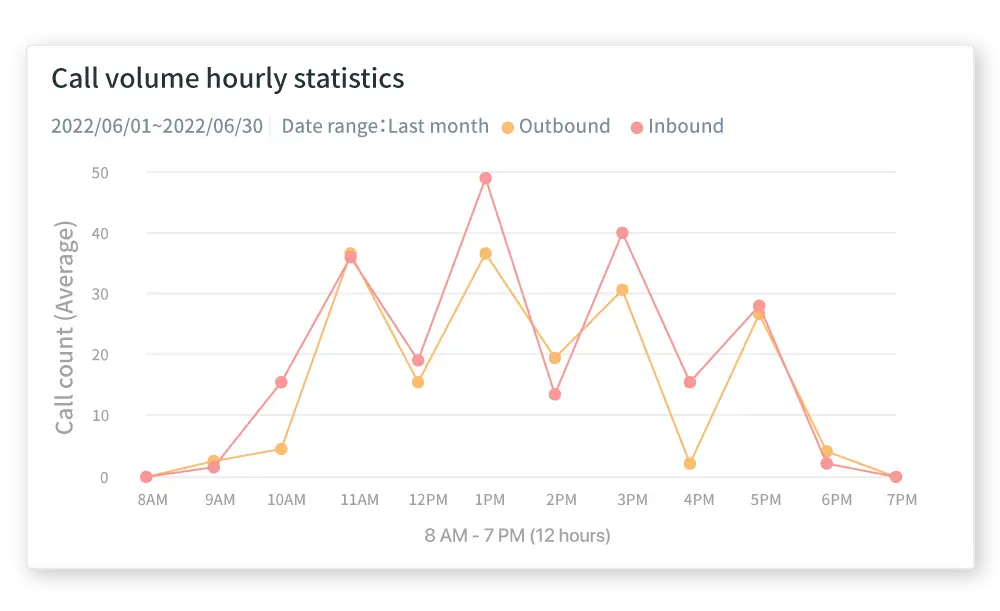
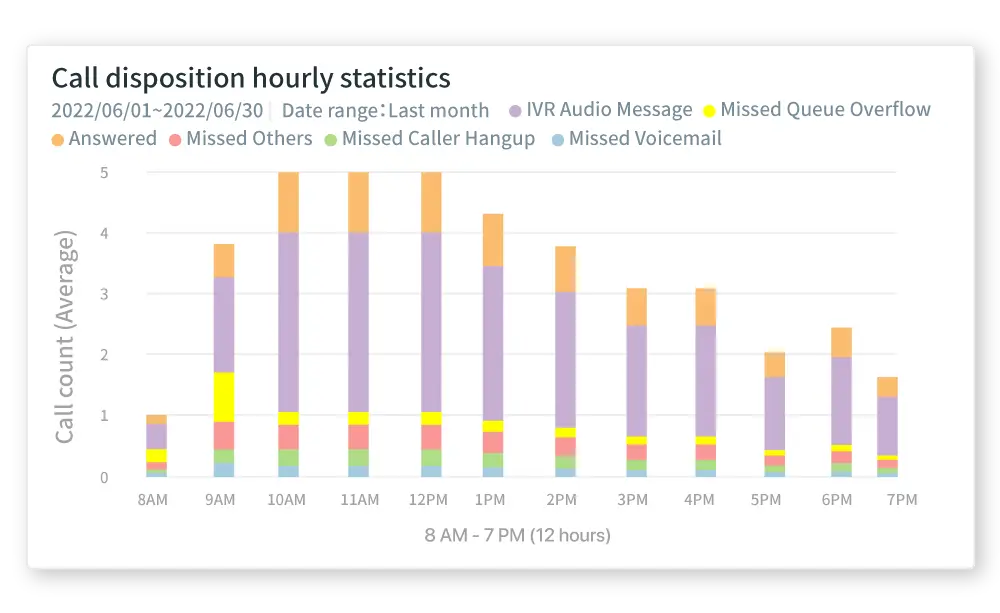
Analyze hourly call traffic per day or per week
Display hourly call volume statistics (average, maximum, or minimum) for each day or over a week to understand traffic distribution per hour.